Statistics for LIS with Open Source R

Statistics for LIS with Open Source R

Search
Skip to content
  • Welcome
  • Inside the Book
    • i. INTRODUCTION TO STATISTICS
      • Let’s Begin
      • Chapter 1 Introduction
      • Chapter 2 Research Design
      • Chapter 3 Data (Types and Collection Methods)
      • Chapter 4 How to run R
    • ii. MAKING SENSE OF STATISTICS
      • More
        • Chapter 9: Sampling Distributions
        • Chapter 10: Confidence Interval Estimation
        • Chapter 11: Fundamentals of Hypothesis Testing
        • Chapter 12: Correlation and Regression
        • Chapter 13: Analysis of Variances and Chi-Square Tests
        • Chapter 14: Time Series and Predictive Analytics
      • Chapter 5 Descriptive statistics
      • Chapter 6: Bivariate Statistics
      • Chapter 7: Probability Theory
      • Chapter 8: Random Variables and Probability Distributions
    • iii. VISUALIZATION IN R
      • Chapter 15: Visualization Display
      • Chapter 16: Advanced Visualization Display
      • Chapter 17: Applying Visualization to Statistics Analysis
  • R Resources
    • R Resources – online console
    • R Resources links
  • Reviews
  • Order this Book
  • Author’s Bio
  • Contact

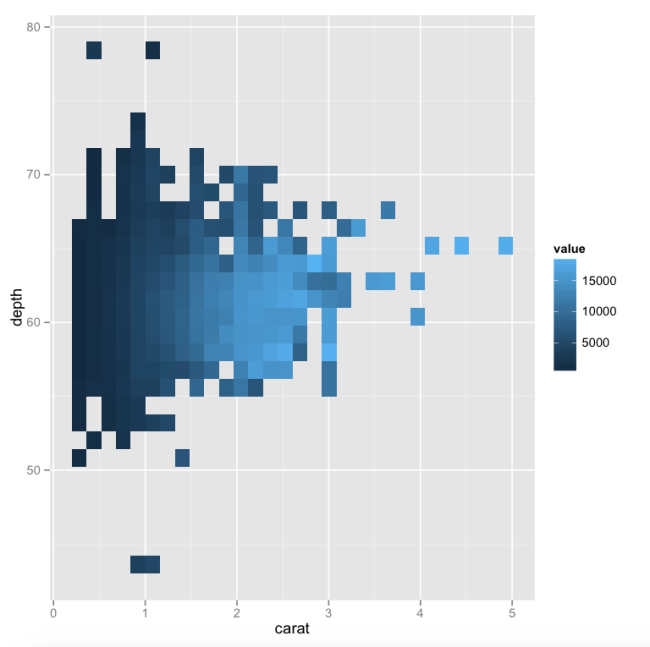
Multivariate data in 2D.

October 19, 2015 650 × 647 Chapter 16: Advanced Visualization Display
Multivariate data in 2D.

Multivariate data in 2D.

Previous Image

A Primer for Using Open Source R Software for Accessibility and Visualization

Statistics for LIS

Click above to order now!

Proudly powered by WordPress